Background
The rapid deployment of photovoltaic (PV) systems across Europe and globally is a remarkable success story in the transition toward cleaner energy. Yet, behind this momentum lies a persistent and largely underestimated challenge: PV plants are underperforming—often silently. In many cases, the gap between theoretical yield and actual energy output remains wide, and unfortunately, not fully understood or addressed by operators.
Recent studies show that the average performance ratio (PR) of PV installations hovers around 75–85%, depending on region and maintenance strategy, with considerable dispersion among sites. For example, data collected across US PV assets suggests that PV plants underperform by 8% (average) compared to expected yield (source: kWh Analytics, Solar Generation Index 2022). These hidden losses accumulate to significant financial shortfalls and carbon opportunity losses, especially as PV scales into the backbone of Europe’s energy systems.
One core reason behind this inefficiency is not a lack of data, but rather a lack of effective interpretation and actionable insight. Almost all modern PV plants are now equipped with real-time monitoring systems, producing vast amounts of operational data: irradiance, power output, inverter status, temperature, and more. But in too many cases, this data is used only for basic alarms or yield comparisons, not for deep performance diagnostics.
This is where the new generation of advanced analytics and data intelligence platforms, like the one developed by Heliocity, comes into play. These tools leverage the raw monitoring data to extract the unique electrical “signatures” that reveal root causes of underperformance, undetectable by visual inspection alone. Soiling, shading, inverter issues, module degradation, inverter clipping, curtailment, thermal losses…: each of these leaves behind a specific footprint in the data, and with the right analytical engine, can be identified, tracked, and quantified.
The ability to discriminate among root causes and quantify the energy losses associated with each is critical. Without this clarity, operators are left with vague underperformance alerts or unexplained yield gaps. With it, they gain precise and actionable recommendations: whether it’s cleaning a soiled array, adjusting inverter settings or inspecting a degraded module string.
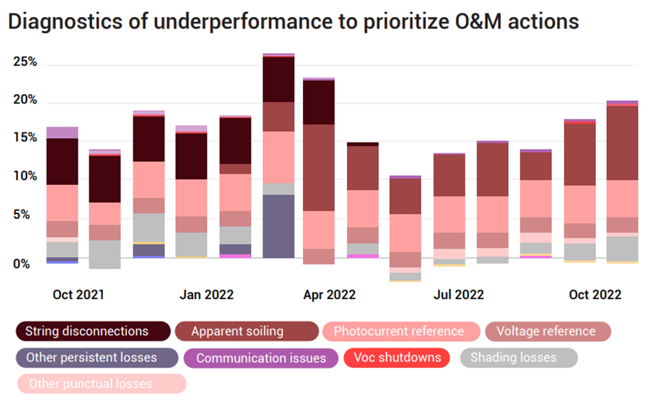
The graph above illustrates how energy losses in a PV installation evolve over time. It shows the breakdown of underperformance as a percentage of the system’s expected theoretical output, based on environmental conditions and equipment performance.
To deliver on this promise at scale, it is essential that diagnostic solutions meet three core criteria: universality, accuracy, and automation. A universal solution must adapt to any type of PV equipment, regardless of manufacturer, age, or configuration—whether rooftop or ground-mounted systems, integrated into greenhouses or other novel applications. It must also be highly accurate, capable of distinguishing not only between different types of faults but also between causes and their resulting effects, thus preventing misdiagnosis and inefficiencies. Finally, the system must be fully automatic, enabling rapid, repeatable, and cost-effective diagnostics across thousands of assets without reliance on manual oversight. These attributes are key to ensuring scalability and consistent performance as the PV landscape becomes more complex and widespread.
In this context, PV monitoring data evolves from a passive recording tool to a proactive decision-making asset. It becomes the foundation of smarter operations and maintenance (O&M), better asset management, and ultimately, higher return on investment (ROI) and energy output. This approach is increasingly relevant as PV asset portfolios grow and become more distributed, making manual inspection less feasible and centralized intelligence more valuable.
Yet, monitoring data alone is not always enough. To truly unlock the full diagnostic power of PV plant supervision, this digital layer must be enriched with real-world field information: the eyes and expertise of operators, high-resolution drone imagery, thermal scans and contextual metadata from the site. For example, drone images can confirm the extent and location of shading or damage suspected from analytics, while an on-site technician might identify physical obstructions, vegetation, or improper tilting that data alone cannot capture.
This convergence of data streams—from sensors, from the sky, and from the ground—is the next frontier in PV asset intelligence. It is one of the central ambition of the Solaris Project, a collaborative effort supported by the European Union and driven by a multidisciplinary consortium of 15 partners. The project aims to build a new ecosystem where digital insights meet operational reality, enabling faster, smarter, and more cost-effective PV diagnostics and performance optimisation.
The challenge is no longer about collecting data—it’s about connecting the right dots, and turning that data into targeted, efficient action.
Solaris Project : Bridging Advanced Analytics and Field Intelligence
In the SOLARIS project, Heliocity serves as the reference expert in PV performance analytics and diagnostics. With years of experience turning raw monitoring data into actionable insights, Heliocity brings to the consortium its unique expertise in leveraging digital data for smarter PV asset management.
Heliocity is responsible for integrating analytical models into an end-user-friendly suite of tools tailored to PV operators. The goal: to build a comprehensive, interoperable digital environment that bridges weather forecasting, energy trading, asset management platforms, and novel hardware such as impedance sensors and next-generation inverters. This ecosystem is designed not only to detect faults, but also to connect those findings to operational decisions and financial impact.
In addition to its backend analytics, Heliocity is developing a dedicated Field App that brings these insights directly into the hands of on-site technicians. This mobile solution will translate remote diagnostics into field instructions and allow operators to enrich the analytics platform with field observations, test results, and drone imagery—closing the loop between data and action.
Heliocity is also building a Fleet Management Engine powered by machine learning, aimed at multi-site operators. This system will continuously analyze plant data to detect patterns, estimate the probability and severity of faults, and help prioritize maintenance interventions across entire portfolios. The ambition is to move from reactive to predictive maintenance—maximizing uptime, minimizing costs, and ensuring sustainable performance across diverse asset fleets.
Within Solaris, Heliocity’s mission is to ensure that advanced diagnostics are not only powerful—but accessible, interpretable and deployable in the real world, empowering PV operators at every level of action.
Work in progress
As the SOLARIS project marks its first anniversary, significant advances have already been made, laying the groundwork for the advanced PV operations tools envisioned by the consortium.
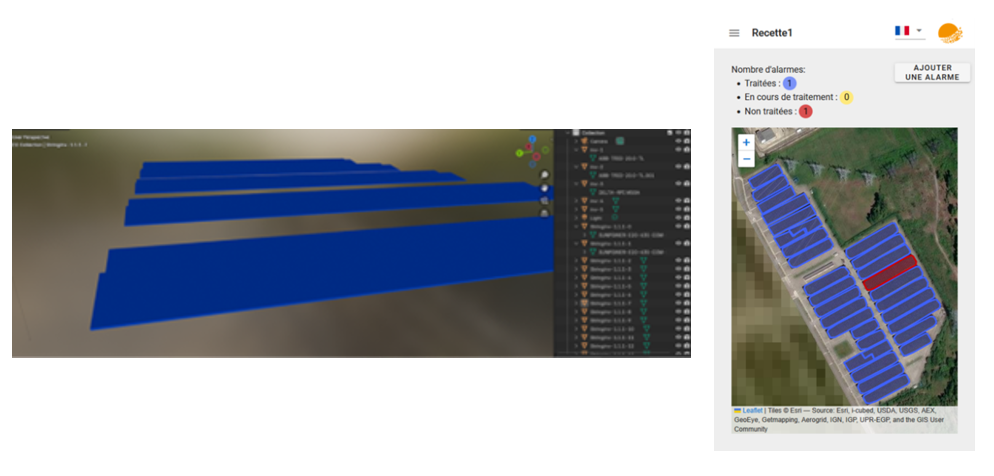
Heliocity has delivered a first MVP of its Field Control App, designed to connect remote analytics with on-site operator actions. This prototype integrates geospatial data and logical electrical layouts using the PVCollada framework, enabling precise fault localization and smoother technician workflows.
On the Fleet Management front, a structured tagging system has been developed to support Supervised Machine Learning algorithms. This foundational step has already led to encouraging results: models can now identify and model soiling patterns, allowing for dynamic cleaning strategies based on site-specific conditions and potential energy losses. This approach promises significant gains in both performance and O&M efficiency. Furthermore as part of the decision making tool under construction, a model chain has been constructed that allows the estimation of performance losses arising from the major failure modes and economic gains through early detection and intervention.
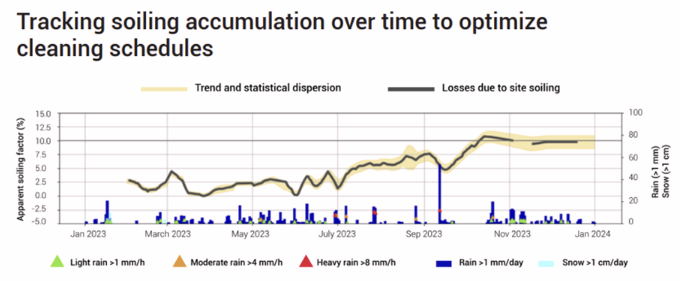
The graph above shows how the soiling factor evolves over time alongside major precipitation events. This information helps reveal the site’s soiling and natural cleaning dynamics and supports the design of an optimized cleaning schedule by balancing cleaning costs, cleaning effectiveness, and electricity prices.
While still at the preliminary stages of development, these initial outcomes demonstrate the strong potential of Solaris to transform how PV plants are monitored and maintained—combining advanced diagnostics, real-time insights and predictive intelligence into a unified operational toolset.